
Initiating and Planning
Tips and Tricks
Search in drop-down list-boxes
To go to a specific
name quickly, type the first few characters of the name in the drop-down
list.
Shortcuts
Several functions can by carried out using various keys. These keys are listed under the different menus.
Examples:
Ctrl+N (new project)
Ctrl+C (copy)
Ctrl+V (paste)
Right-clicking mouse
Throughout the application, you can right-click on the mouse to quickly add information. and insert or remove lines, roles or personnel.
You can right-click on items in the Project Tree located at the far left of the window for many actions. For example, right-click on a Milestone icon and the following choices will be displayed:
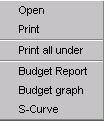
- Open (this opens the milestone plan)
- Print (this will print out the milestone plan)
- Print All under (this will print out all reports belonging to this milestone plan)
- Budget Report (this will show a variance report on your screen)
- Budget Graph (this prints out the variance report graphically)
- S-Curve (graphic variance report)
Principle chart, Responsibility chart and Activity schedule: To Add New Lines right-click on the left column of an existing line. You may also Connect(insert), Replace, or Delete Roles or Persons by clicking on an existing role or person .
Milestone Plans: to Add New Lines right click in the left column of an existing line. You also right-click to Add, Insert, Delete or Edit result paths.
Drag & Drop
To move lines up or down on the Principle Chart, Milestone Plans, and Activity Plans (not Milestone Responsibility Charts): click and drag the left column of a line you wish to move. Result paths: click and drag the result path heading to the right or left. In the Responsibility Chart, roles and people can also be dragged and dropped, as above.
Tab key
The tab key is used in all dialog boxes to continue to the next field.
Arrow keys
Within the Principle
chart, Milestone Plans, and Activity Responsibility charts, the arrow
keys are used to scroll (scrolling down below the last line will add
new lines).
Within a plan in
the responsibility charts, the arrows can be used to navigate through
the estimate columns.
Within Activity Reports, it is also possible to use the arrow keys to continue to the next report.
Tool bar
 This
symbol enables you to open a project
 This
symbol enables you to save changes
 This
symbol enables you to print out the active document
 This
symbol enables you print out a preview and copy the document as a .gif
file
 This
symbol enables you to show or hide the project tree (project document
structure at the left side of the window)
Warning Messages
Red messages appear in the Tool bar to inform you of conflicts. For example, a red message appears if you have entered an invalid date format.
Project tree
A project tree is shown in the far left frame that displays all the project's files including the Principle chart, the Mandate, Milestone plans, Responsibility charts, Activity plans and Reports. All reports that are printed out from Goal Director are stored under files in the project tree as sub-files and are important as they document the project's history. Sub-files can be shown by clicking on a file's + sign. You can delete reports by right-clicking on the report and clicking on Delete.
If you wish to print out all information in a file or sub-file, you can highlight the it and right-click and select Print All under. If you only want to print out the first document (for example, the Milestone Plan) right-click and select Print.
Working on a Local
database or a Central database (on a server)
Users who normally work on a server database also have the option to work on a local database (on their workstation hard disk). This is done by clicking File>Local.
Logging out
If you wish to
leave your machine for any length of time, you do not need to quit Goal
Director. You can click File>Log Off. When you return, you
click File>Log On.
Gantt-diagram in the responsibility charts
To view a Gantt-diagram in the Responsibility charts, click View>Gantt-diagram. You may drag the bars in a Gantt-diagram to modify start and finish dates.
Starting up Goal Director
You may start Goal Director in different modes from the Start>Program
list:
Select Goal Director>Application
(it is found under Programs) for the stand alone version
Select Goal Director>Client
if you are running the it as a client connected to a Goal Director server
program. (make sure the server program is running)
Logging On
Upon starting up Goal Director, a Log on dialog box appears. You may filter the Name list by selecting a specific Organization and Unit. This is a useful feature when working in a large organization.
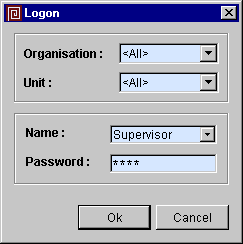
Click Ok
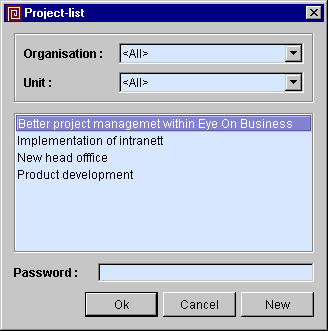
and the following Project-list window pops up. You may easily
and quickly find a project by selecting your Organization and Unit.
Opening an existing project
Select a project and click Ok. If the project has a password, you must enter the password before you click Ok.

Creating a New Project
In the Project-list window, click New or use the shortcut keys CTRL+N.
When you create a New Project, you can specify several options:
Organization and Unit
Select which Organization and Unit the project belongs to.
Project Name, Number, and Code
Type in the Name of the project. If the project has them, you
may type in the Project Number and Code. These numbers may be used to
integrate Goal Director with another application (such as a financial
system).
Password
You can also add a password to limit access to the project..
Language
Select the Language the responsibility codes, headings and printouts
will display. English is the default.
Manager
Select a Manager (Project Leader) for the project.
Program Manager
Select the Program Manager if this project is part of a program (related
group of projects). A Program Manager can make status reports
on projects that are part of his program..
Project Proposer
Select a person from the drop down list
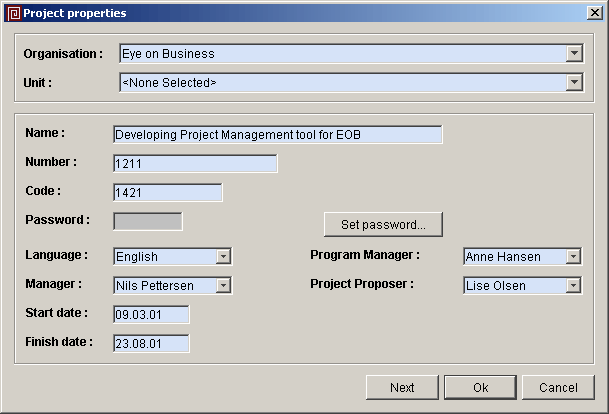
Click Ok or Next to save your settings. A Project Tree structure will be displayed on the left side of the window. The top of the tree structure shows the location of the database.
If you wish to go back and modify the project properties, you can click
File>Project properties (or right-click
on the project icon in the project tree),.
Classifying a project
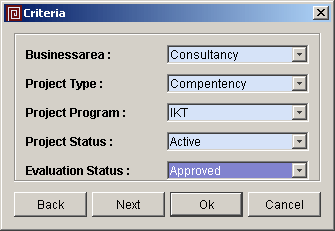
If you clicked Next in the Project Properties dialog, the following Criteria dialog appears where you can classify the project according to predefined criteria. Standard criteria may be defined by each organization (see Classification Criteria):- Business area
- Project Type
- Project Program
- Project Status
- Evaluation Status
Mandate
if you clicked Next from the Criteria dialog, the following Mandate dialog appears. This dialog is also available by clicking Report>Mandate. Here you click the gray buttons on the left to set values for each mandate category as shown below:
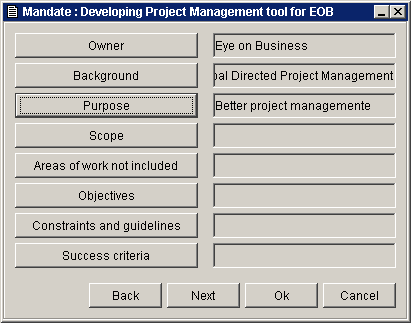
The Mandate can be printed or saved as a .gif by choosing Print Preview in the tool bar, and then selecting Copy in the preview tool bar.
Click Ok or Next to save the Mandate.
Budget
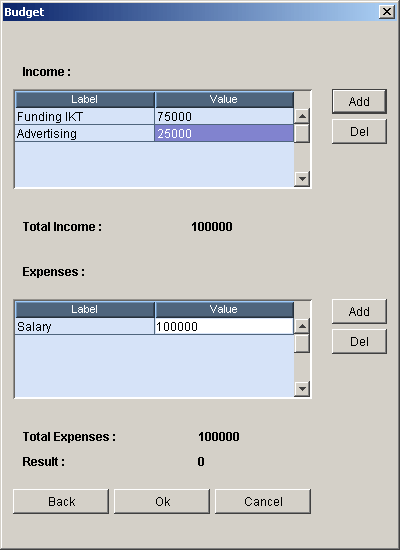
If you clicked Next from the Mandate dialog, the following Budget dialog appears.In this dialog you enter income and expenses for the project into different accounts. See Classification Criteria for information on how to make accounts.
Add a new budget line item
Click Add to enter a new Budget line item. Choose an account from the drop-down menu on the left. Then insert the desired value in the value-field.
Check that the total is updated before you press Ok to save.
Delete a budget line item
Select the record you want to delete and press Del. Check that the total is updated before you press Ok to save.
Principle Chart
A Principle Chart is located at the top of the Project Tree (it is
initially blank when a new project is created). A Principle chart
is used to specify organizational guidelines or procedures for project
work. (eg. Approval of planning documents)
Copying Principle Charts
A Principle Chart can be copied to/from other projects by clicking
File>Copy Principle Chart.
Using this feature, you may copy a standard Principle chart from an
organization's "template" project
To open the Principle Chart, double-click on the Principle Chart listed
in the Project Tree.
Adding new principles
To add new lines click Edit>Add
Line, You can also create a new line by using the following
buttons in the chart's tool bar:

Assigning Roles to Principles
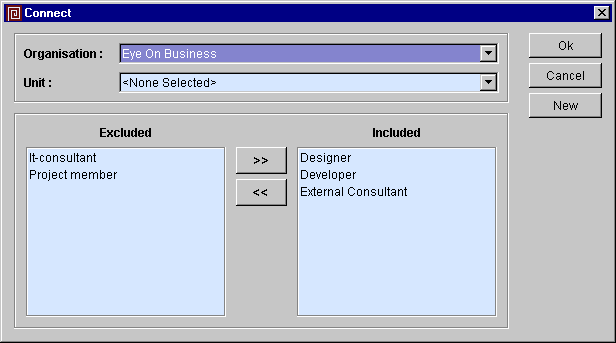
To assign roles to principles, right-click in the resource assignment
area of the window (upper right), select connect and the window below pops up.
You can "Connect" roles that are responsible for principles. If
you have defined Organizations and Units, you can filter the roles.
If you have not already pre-defined roles, you can create new ones by
clicking on the button entitled New
and then enter the name of the new role.
Assigning task responsibilities to
roles
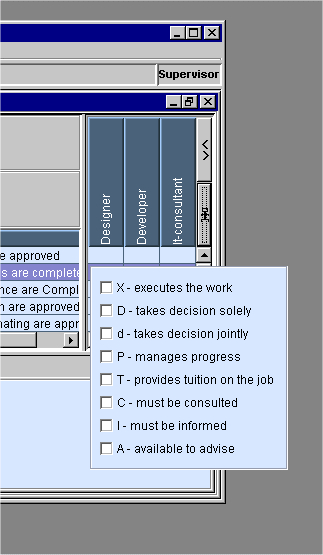
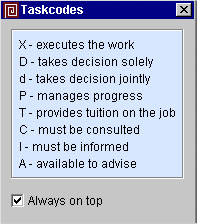
You can select pre-defined task codes to define specific responsibilities
the roles have in executing the principles. The task codes can be selected
by right-clicking in the task code field. See the example below:
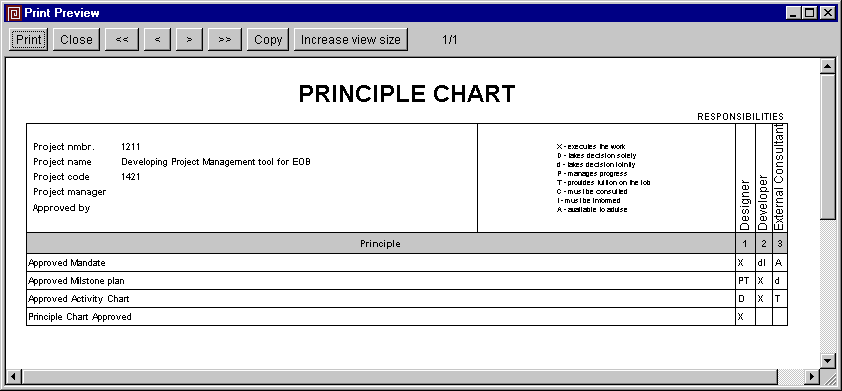
In the example
below, we have entered a principle called "Approved Mandate", and we
have connected the roles: Designer, Developer and External Consultant.
We have also assigned specific task codes to those roles

Printing, Previewing, and making .gif
files
Plans, charts and reports can be printed out, previewed or copied as
.gifs and put into other applications like Word, Notes, etc.
If you wish to print something, click on the printer icon in the tool bar. If you wish to view something on the screen, click on print preview icon in the tool bar. If you wish to use the print preview in a document, click on Copy and a dialog box will pop up where you can save it as a .gif file.
Milestone Plan (High-level model of intermediate goals)
Milestone Plans are practical models of a project segment (phase, sub-project...)
that communicate to everyone in the organization the intermediate goals
to be achieved in that portion of the project. Milestone plans
should include only milestones that can be planned with an acceptable
amount of uncertainty and risk.
To create Milestone Plans within the project, click File>New Milestone Plan.

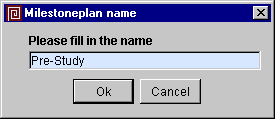
The following dialog appears. Enter a name for the Milestone Plan
and click Ok to create it. If
you wish to revise the name later, select File>Properties
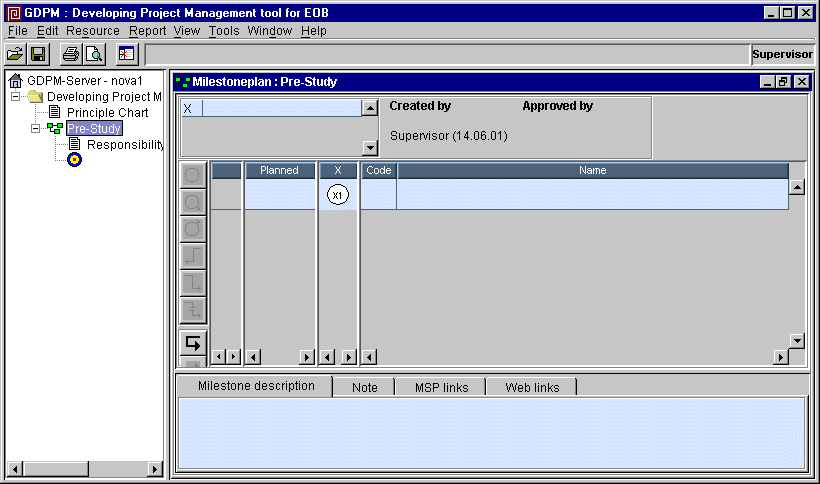
You can now start defining Result paths (Focus Areas) to categorize
the Milestones. To Add/Delete/Insert or make changes to a Result path,
right-click on the result path column heading. Although Goal Director
supports up to 7 result paths, we recommend that a maximum of 4 result
paths be used to maximize clarity.
Entering new Milestone lines
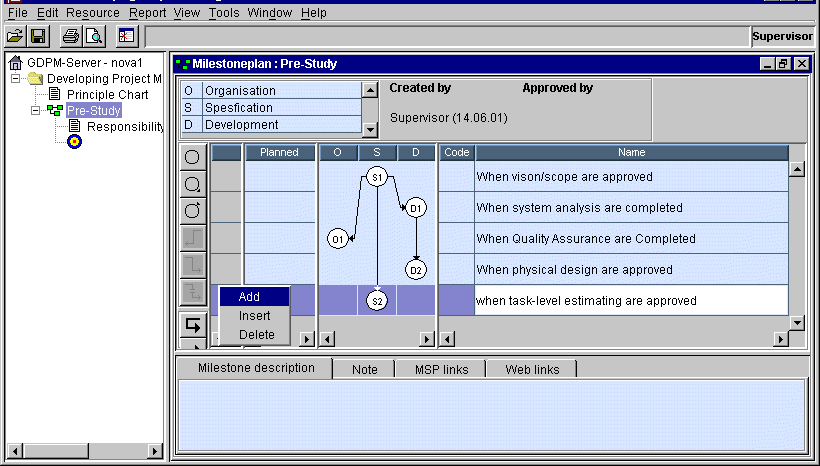
After you have created result paths, you can begin to Add/Insert/Delete
Milestone lines. This is done from the Edit menu or by using the buttons
on the left side tool bar, or you can right -click in the left column.
Adding additional Nodes
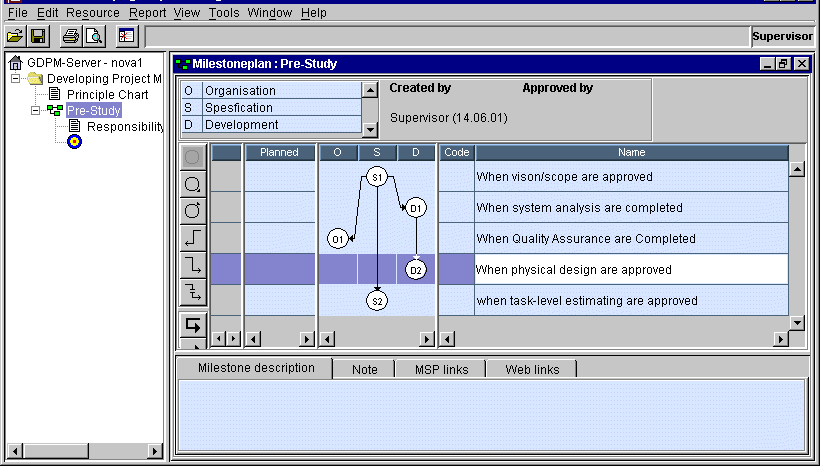
You may link milestones. In the example below, you see several
linked milestones. To enter additional nodes for a Milestone line, you
can highlight the column where you wish to place an additional node
and click on the following symbol in the tool bar.

If you want to remove
nodes from a milestone plan, just right-click over the node and select
Delete.
Milestone description tab
For each milestone, you have the option of entering a longer description
to describe the milestone. in the tab below the Milestone chart.
Note
tab
You can also use the Note tab
to enter more information about the milestone. This is a good
place to start documenting activities that may be involved in achieving
the milestone. a symbol will pop up (as shown below) on the milestone
where you have entered the note.
Hyperlinks
tab
You may enter links to associated web sites on the internet, or documents
on your intranet (by using mapped network drive designators eg. "z:\..."
Planned
finish dates
In the column entitled "Planned", you may enter the planned finish
date for milestones. These finish dates along with start dates,
may also be created in the Milestone Responsibility Chart described
later..
Viewing
revised milestone finish dates
If you want to view revised Milestone finish dates (as created from
a prior milestone report), click View>Revised
dates. Creating these revised dates is described in the
Reporting and Controlling topic entitled "Revising
milestone dates".
Linking
Milestones
You can now start specifying relationships between Milestones. In the
example above, we created a relationship between the milestones "System
Analysis Completed" and "Quality Assurance Completed". This dependency
means that before we can complete Quality Assurance, the System Analysis
must be completed.
To link milestones,
highlight a milestone, then either right-click or push the following
buttons in the left tool bar, and then click on the milestone to be
linked.
![]()
![]()
Deleting
links
If you have created a link you wish to remove, click on a node, then
click on the icon shown below (or right-click), and then click on the
linked node you wish to remove the link between.
![]()
Links
between Milestone Plans
This feature is useful in larger projects where deliveries sometimes
need to be made to other milestone plans. It is also useful, if you
wish to create a hierarchy of Milestone Plans, where one Milestone Plan
is the "superior" that is then linked to all the other milestone plans.
To enter links,
click on the MSP links tab and
choose Add. A dialog box will
pop up where you can select a milestone plan and the milestone with
which you want to establish a link. See example below
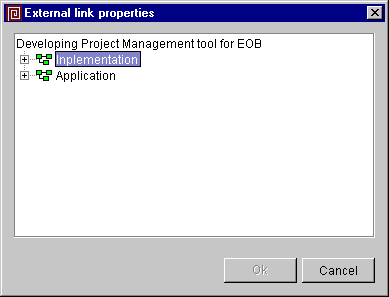
If projected completion dates in the connected milestone are prior to the projected completion date that you have set up for your milestone in your sub-project, Goal Director will notify you. This could mean that you will have problems with delivery; nevertheless, Goal Director will allow you to create a link.
We recommend that you use special Milestone symbols to indicate that a a milestone has an incoming or outgoing link. To do this, click on the node to which you have created an external connection, and then click on the incoming or outgoing icon on the tool bar.
![]()
![]()
Indicating
Approval of Milestone Plans
When the milestone plan is approved (perhaps as you have documented
in the Principle Chart), you can indicate that the Milestone plan has
been approved by selecting Milestone
responsible from the Edit menu and then enter the person who
has given approval and the date of approval.
Copying Milestone Plans
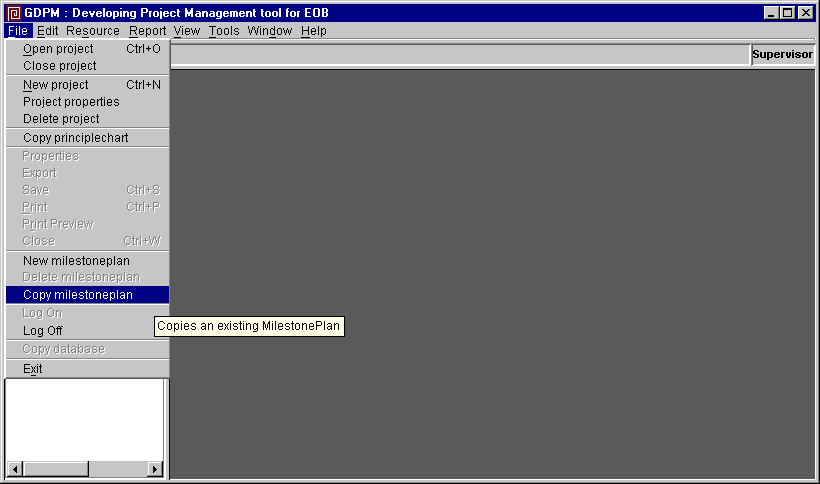
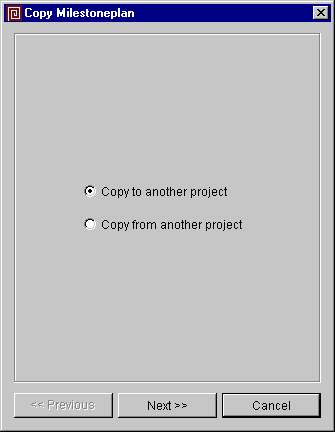
If you wish to copy a milestone plan to or from another project, it can be done from the by clicking File>Copy milestone plan.
Choose whether
you want to Copy to or Copy
from another project:
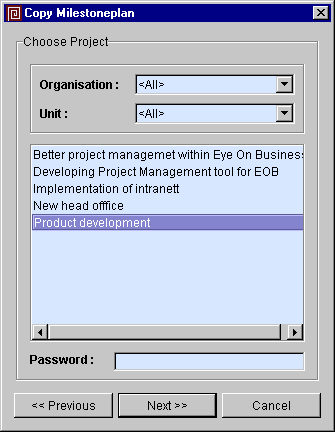
Choose the project:
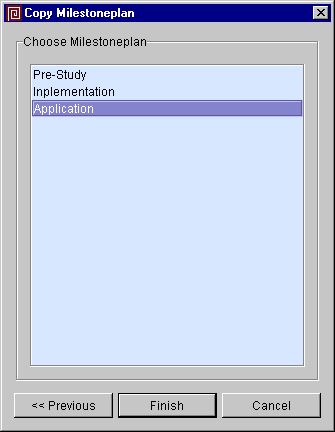
Choose the milestone plan:
You will be given
an opportunity to give the copied Milestone Plan a different name.
Milestone Responsibility Chart (High level roles, responsibilities,
and estimates)
For each Milestone Plan, Goal Director automatically generates a high
level Responsibility chart, that shows the milestones you created in
the Milestone Plan. (you cannot enter new Milestones). The Milestone
Responsibility chart is used to identify required roles and groups within
the organization to work on the milestones.
The first time you open a Responsibility Chart, you must enter the start and end dates for the entire milestone plan. In addition, you must select the initial Gantt scale (days, weeks, months). You may also enter the interval for the scale. Example: If you choose the interval "2 weeks", Goal Director will print out a Gantt diagram that shows every other week.
Click Ok to save the changes.
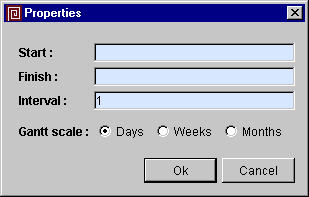
The next step is to link roles/groups (not specific persons) to milestones listed the Responsibility chart. This is accomplished by adding roles/groups for decision makers, liaisons, and experts needed to participate in accomplishing each milestone.
To link the roles, click on Connect from the Edit menu or you may right-click in the upper right area of the responsibility chart, or click on the stick figure.
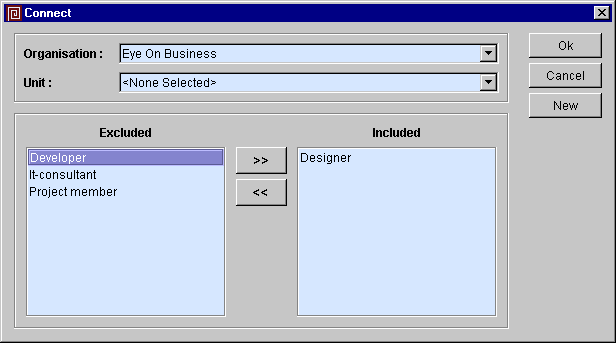
Milestone Responsibility Chart elaboration
In cases where a milestone belongs to several result paths (multiple
nodes), there may be various roles responsible for following through
for each node. In the Responsibility chart, initially, one line
is generated for each milestone. You can, however, enter sub-lines in
each milestone by highlighting the entire line and selecting Insert
Line from the Edit menu. (You may also right-click on the left side
of the existing line). You may now give the line a descriptive name.
These lines may not be moved
Assigning
task codes to roles
Task codes can be displayed by selecting Task codes under the Help menu. This
list can remain open while you define responsibilities for the various
milestones.
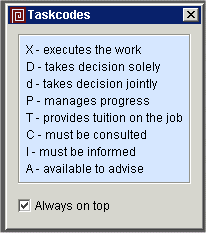
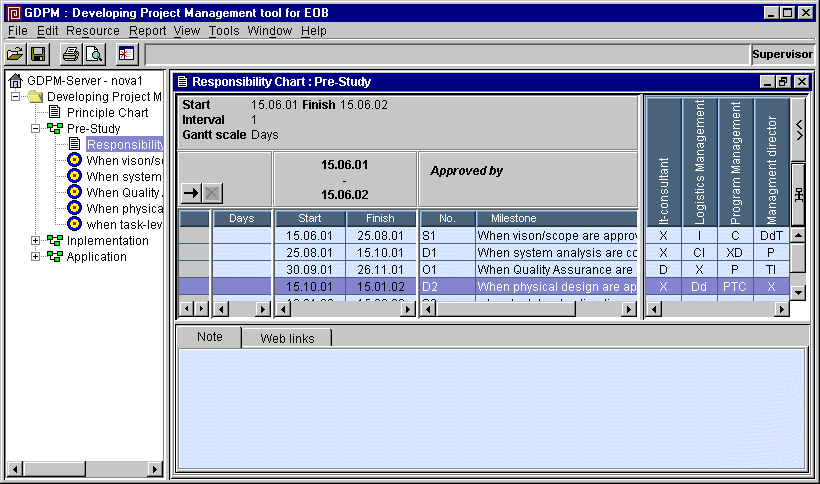
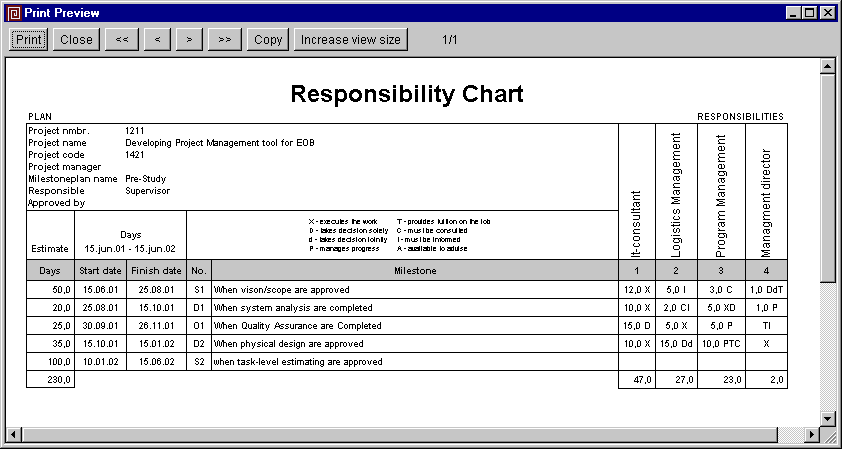
You may enter the responsibility task codes manually or by right-clicking in the field where you wish to assign a responsibility Multiple responsibilities can be assigned. See the figure below:

In the example below, we have given It-consultant the responsibility of executing the work necessary to accomplish the milestone "When vision/scope are approved". This is specified by entering a X for this milestone and this role.
High
level Milestone Estimating
The Milestone Responsibility Chart allows you to make overall
high level estimates of effort required for each milestone. We recommend
that you involve people from various areas of expertise to assist in
these estimates. These estimates are high level only, and will
not be be used for progress tracking. However, they are
very useful in creating a model to communicate to the actual people
who will subsequently make lower level plans to accomplish the milestones.
You may directly
enter your estimate of total effort required to accomplish
a milestone in the left hand column. The estimate of total effort will
be displayed in the units of time you selected when you created
the project responsibility chart. If you wish to change this unit, right-click
over the estimate column on the left side of the chart where the heading
displays Hours, Days, Weeks, or Months. A window will pop up that enables
you to choose a different unit for estimating effort.
Displaying
responsibility task codes and estimates
Right click on a role name and you may select Estimates, Task codes, or Both (both estimates and task codes), or you
may select this from the View menu.
Summarizing
the total effort estimated for all roles for each milestone
You can summarize all effort for all roles in the left hand column by
selecting Sum Estimates from
the Edit menu.
Over-writing
the calculated total effort
After summing the total effort, you can over write the calculated total
with a different value. This manually over written value will
be displayed as a blue number.
Scheduling
the overall schedule duration to accomplish milestones
You may enter dates in the Start and Finish date columns
directly, or you can click on Gantt
in the View Menu and then click and drag the gantt schedule bars.
You can change the gantt scale by editing the Properties
from the File menu.
Notes
and Hyperlinks
For each line of the Project Responsibility chart, you have the option
of entering notes and hyperlinks in the tabs at the bottom of the window.
For example, you can use these tabs for a more comprehensive description
or acceptance criteria of the product that is to be delivered for the
milestone.
Approval
of the Responsibility Chart
Finally, the responsibility chart is approved by choosing Milestone responsible from the Edit menu.
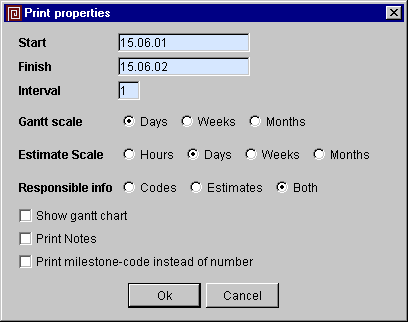
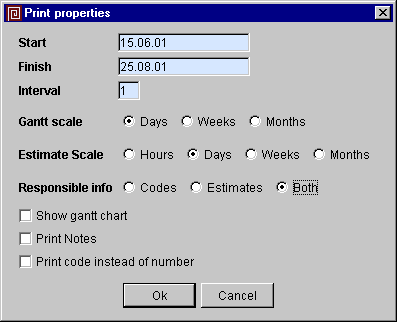
Printing
When you opt to print out a Responsibility chart, you will be asked
to choose the options: time period, print out estimates, responsibility
codes or both, show Gantt diagram. Click Ok to print. If
you get a message saying that the printout is too wide, you might
try changing the start and finish dates to shorten the date range of
the gantt chart to be displayed.
Printing,
Previewing, Making .GIF files
Throughout Goal Director, you can print reports to either a printer,
screen or a .gif file that can be put into other applications
(for example Word, Notes etc.) If you want to send a report to a printer,
click on the Printer icon in
the tool bar. If you want to preview on the screen, select the Print Preview icon in the tool bar. If you
want to make a .gif file click on Copy in the Print Preview tool bar to save
it to a subdirectory of your choice.
Activity Schedule (Low level planning and control)
For every milestone, Goal Director automatically generates a low level
empty Milestone/Activity Schedule that includes a responsibility chart
to enter responsibilities for specific persons. Under each Milestone
Plan in the project tree on the left side of the screen, you will find
each individual Milestone/Activity Schedule.
If you wish to track progress against the plan, activities must
be added to the Activity Schedule with specific Persons assigned responsibilities
in the responsibility chart area with estimated effort for their contributions
on activities.
To work on an Activity Schedule, double click on the Milestone/Activity Schedule icon in the project tree.

The first line on the Activity Schedule
This will always reflect the high level milestone information
including: description, estimated effort, and start and finish dates.
The information is displayed in a shaded color and may not be modified.
Notes created in the high level Milestone Plan will also be shown in
the Note tab at the bottom of the window in a shaded color. This
information is useful to guide the detailed planning that can occur
in this Activity Schedule.
Create
activities
To create activities, select New Line
from the Edit menu, or use the icon in this window's tool bar.

When you enter activities (new lines), a number is automatically generated comprised of the milestone's identifier and the next available consecutive number.
On each line enter
the name of the activity. This name should be as descriptive as possible,
as the activities are used for reporting by each person assigned to
work on the activity. In addition, you can enter supplemental descriptive
information in the tabs at the bottom of the window. (Notes, Hyperlinks)

Assigning
activity tasks to persons
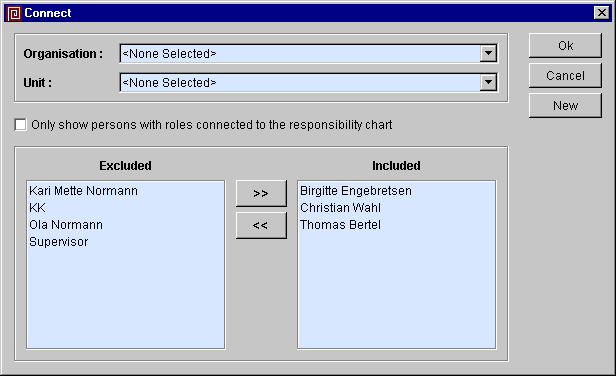
On the Activity Schedule, we can "connect" (assign) the persons who
will work on specific tasks (task codes) to accomplish the activities.
To connect people to the Activity Schedule, select Connect
from the Edit menu, or click on the stick figure at the far right of
the chart or right-click on the mouse in the assignment area.
A dialog box is
displayed as shown below.
Only
show persons with roles connected to the Milestone Responsibility Chart
If you wish to filter out people who do not have roles "connected" in
the Milestone Responsibility chart, check the box entitled "Only show
persons with roles connected to the responsibility chart"
Connecting (assigning) Persons task
code responsibilities
(this is essentially the same as "Assigning
task codes to roles"
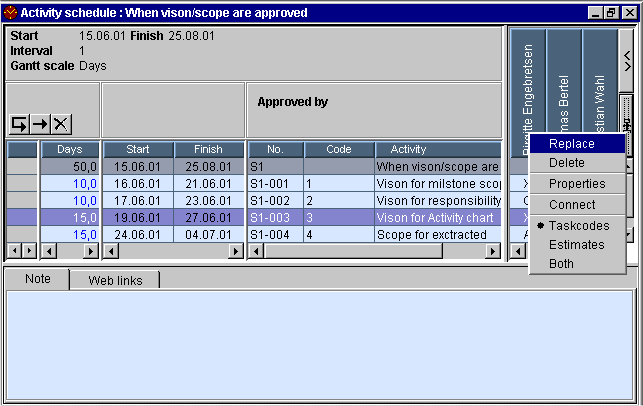
The Connected Persons are shown in the upper right area of the activity responsibility chart and they may be assigned task codes by right-clicking or entering the code directly into the field.

Low
Level Activity Estimating
The Activity Schedule allows you to make low level detailed
estimates of effort required for each activity. We recommend that you
involve people from various areas of expertise to assist in these estimates.
These estimates are required if you wish team members to report their
progress on their activities.
You may directly
enter your estimate of total effort required to complete
an activity in the left hand column. The estimate of total effort will
be displayed in the units of time you selected when you created
the project responsibility chart. If you wish to change this unit, right-click
over the estimate column on the left side of the chart where the heading
displays Hours, Days, Weeks, or Months. A window will pop up that enables
you to choose a different unit for estimating effort.
Displaying
responsibility task codes and estimates
Right click on a role name and you may select Estimates, Task codes, or Both (both estimates and task codes), or you
may select this from the View menu.
Summarizing
the total effort estimated for all persons assigned to each activity
You can summarize all effort for all persons in the left hand column
by selecting Sum Estimates from
the Edit menu.
Overriding
the calculated total effort
After summing the total effort, you can over write the calculated total
with a different value. This manually over written value will
be displayed as a blue number.
Scheduling
the overall schedule duration to accomplish an activity
You may enter dates in the Start and Finish date columns
directly, or you can click on Gantt
in the View Menu and then click and drag the gantt schedule bars.
You can change the gantt scale by editing the Properties
from the File menu.
Notes
and Hyperlinks
For each line of the Activity Schedule, you have the option of entering
notes and hyperlinks in the tabs at the bottom of the window. For example,
you can use these tabs for a more comprehensive description or acceptance
criteria of the product that is to be delivered by the activities.
Approval
of the Activity Schedule
Finally, the Activity Schedule is approved by choosing Milestone responsible from the Edit menu.
Printing
When you opt to print out a Activity Schedule, you will be asked to
choose the options: time period, print out estimates, task codes or
both, show Gantt diagram. Click Ok to print. If you
get the message that the printout is too wide, try shortening the gantt
start and finish date range.
Throughout Goal Director, you can print reports to either a printer, screen or a .gif file that can be put into other applications (for example Word, Notes etc.) If you want to send a report to a printer, click on the Printer icon in the tool bar. If you want to preview on the screen, select the Print Preview icon in the tool bar. If you want to make a .gif file click on Copy in the Print Preview tool bar to save it to a subdirectory of your choice.

Note regarding Activity progress reporting
If you wish persons to report progress against their activities, you
must connect the persons in the responsibility area of the Activity
Schedule. A person's activity report will only include activities that
are scheduled in the period of the report. If a report week is
beyond the finish date of an activity. you may displace
activity date (extend finish date) on the Tools menu. so
that the activity can be included in the report.
Copyright Goal
Directed Project Management Systems Ltd ~ All rights reserved