
Reporting and Controlling
Activity Reports
Team
members can report progress and provide notes regarding status on
activities they have been assigned responsibilities for in Activity
Schedules.
Click Report>Activity Report, Goal Director will open a dialog box, giving you the option of selecting the year and week to report. The week you are currently in is the default week. (you may also report for others by selecting that person's name under Person in the drop-down menu.)
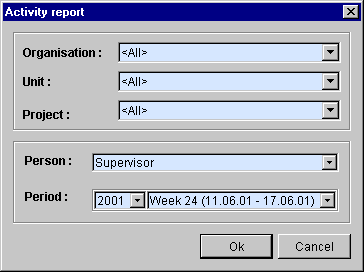
After you
have chosen a year and week for the report, a window will pop up with only the activities that
the person is scheduled to work on during the period you have selected.
(If the period selected is beyond an activity finish date, the activity
will not appear on the report. To report on those late
activities, the activity date must be extended by clicking Tools>Displace activity dates. (see Extending Activities))
At the far
right of the window you may view activity information such as the
scheduled finish date and original estimates. You may customize the
view by clicking on View>Personal
Activity Report and then select options.
Activity report fields
You may report the following progress information for activities in the columns in the left area of the window:
Work Done
Here you may report the total number of hours or days you have worked
in the period. If you wish to report on your work accomplished each day
of the week instead of for the entire week, you may click View>Personal activity report>Show
Weekdays.
Work to do
This is the amount of time, in hours and days, that you estimate will
be required to complete the activity.
On schedule
Enter a Y or N according to whether or not you will make the scheduled
finish date.
Quality accepted
Enter a Y or N according to whether or not the quality of the work you
have done is good enough.
Responsibility Chart kept
Enter a Y or N according to whether or not people worked on the
activity according to the responsibility chart.
Changes Required.
Enter a Y or N according to whether or not modifications were necessary
on the work you have accomplished.
Waiting time
Enter a Y or N according to whether or not you were required to wait
for other people to complete their tasks before you could start or
continue your work.
Special problems
Enter a Y or N according to whether or not special problems have
arisen. The text field under is available for expanded descriptions.
Delay
Report delays for the activities.
Accumulated
This column shows the sum of prior reported hours, days, weeks or
month.

Annotating the report
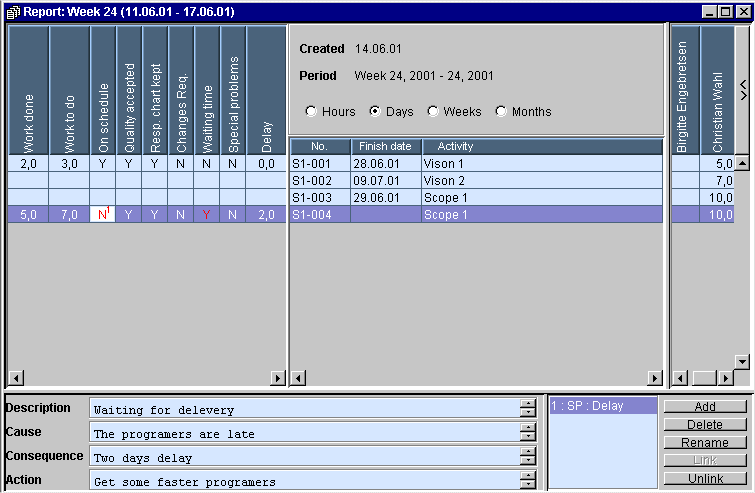
For example, if you report N for the field On Schedule,
Goal Director shows this in a red color. You may annotate any of
the Y or N answers in the following way:
- Click on
Add in the lower
right area of the window
- Give the annotation a description name.
- Type your comments in the fields: Description, Cause, Consequence, Action.
- Highlight
the Y or N field you wish to annotate.
- Click on Link to connect the annotation.
Comments can be deleted or given a new name by highlighting the comments and clicking on Delete or Rename.
If you wish
to delete a connection you already have created, you can highlight the
report field and click on Unlink.
Viewing Activity Report options
Sort by
The activities are initially shown and sorted by activity code. You can
show and sort by the full identity of the activities by
clicking View>Personal activity
report>Sort by>Project, Milestone Plan, Milestone...
All : Shows all activities you are scheduled to work on, in every time period.
Ongoing: Shows all activities you are working on in the current period.
Ongoing
and recently worked on: Shows all activities you are working on in
the current period plus the activities you worked on in the previous
period (week).
When all team members have created their Activity reports, Project
Leaders and others can then create an overall report aggregating those
individual activity reports by clicking Report>Aggregate. It will
show the aggregate total work hours, remaining work and all the
annotations of problems or issues on specific activities.
Printing Activity Reports
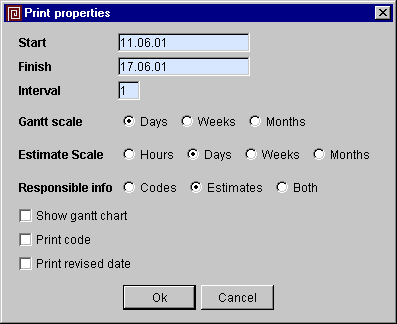
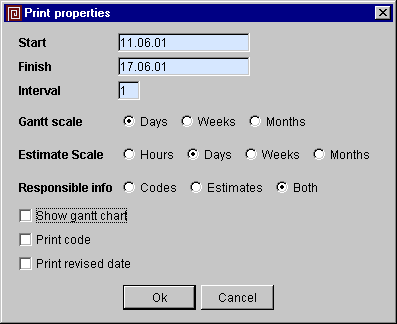
You can choose print properties to control: time period, Gantt display, Codes, Revised dates, Responsibility codes, Estimates, or Both.
Click Ok to print.
Printing, Previewing, Making .GIF files
Throughout Goal Director, you can print reports to either a printer,
screen or a .gif file that can be put into other applications
(for example Word, Notes etc.) If you want to send a report to a
printer, click the Printer icon in
the tool bar. If you want to preview on the screen, click the Print Preview icon in the tool bar.
If you want to make a .gif file click on Copy in the Print Preview tool bar
to save it to a subdirectory of your choice.
Aggregated Activity Reports
All Activity Reports as submitted by all team members working on the project can be aggregated together. This report enables a project leader to consider annotations made by team members, and make necessary changes. These reports may also be used to provide overall progress information to oversight groups.
Report types:
Aggregate reports can be summarized at the following levels:
- Activity level
- Milestone level
- Project level
Aggregate
reports are run by clicking Report>Aggregate.
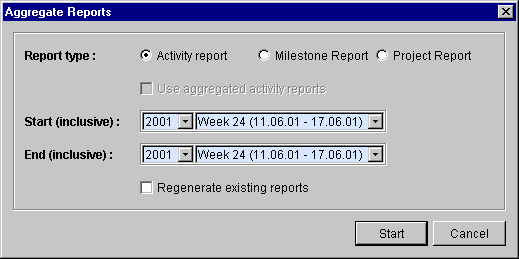
The dialog box shown below enables you to choose which type of report
and which time interval you want to run. You can also update existing
reports by checking Regenerate
existing reports.
Click on Start to create the aggregate report.
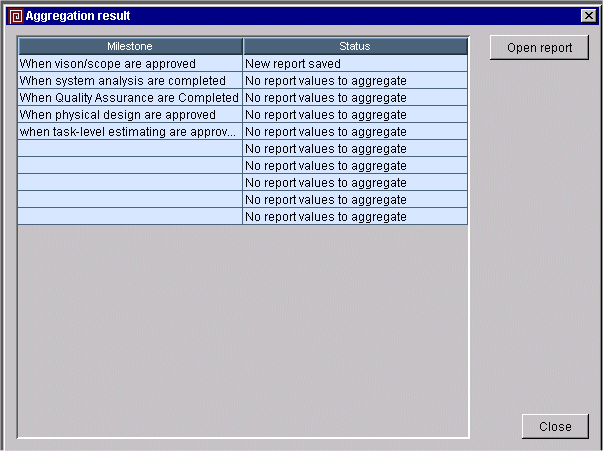
After Goal Director has finished aggregating your report, a dialog box will pop up (see below) telling you if a New report has been saved and for which Milestone. To view a report, highlight the desired report and click on the button Open Report. The reports are saved under the indicated Milestone in the project tree corresponding to the report's level.
Deleting reports
All reports that have been printed out are kept to maintain a project
report history. It is, however, possible to delete reports by right
clicking on the report in the project tree and clicking Delete.
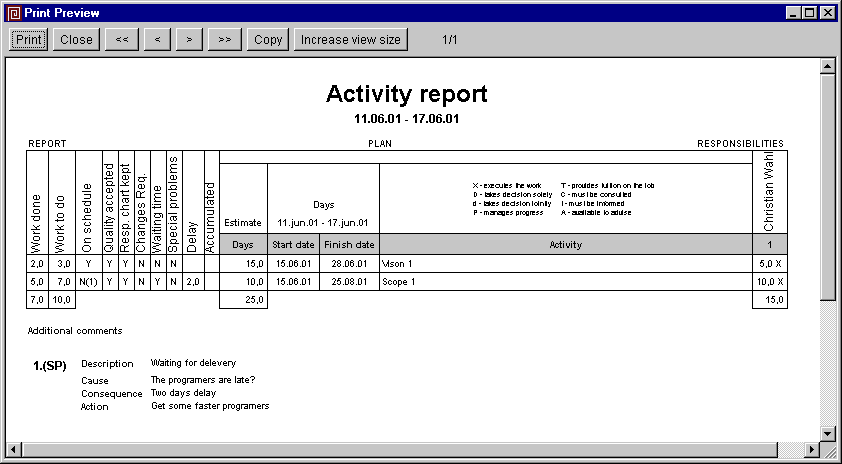
Below is an example of an Aggregate Activity Report that shows the
aggregated status and annotations reported by all people who submitted
activity reports for the various activities for the selected period of
time.
Printing the report
You can choose print properties to control: time period, whether to
display the Gantt, Codes, Revised dates, Responsibility codes,
Estimates, or Both.
Click Ok to print out..
Throughout Goal Director, you can print reports to either a printer, screen or a .gif file that can be put into other applications (for example Word, Notes etc.) If you want to send a report to a printer, click on the Printer icon in the tool bar. If you want to preview on the screen, select the Print Preview icon in the tool bar. If you want to make a .gif file click on Copy in the Print Preview tool bar to save it to a subdirectory of your choice.
Accumulated work done
The accumulated work done report shows work done pr person for the selected projects, persons, on different levels. To open the Accumulated work done report, click Report>Accumulated work done.
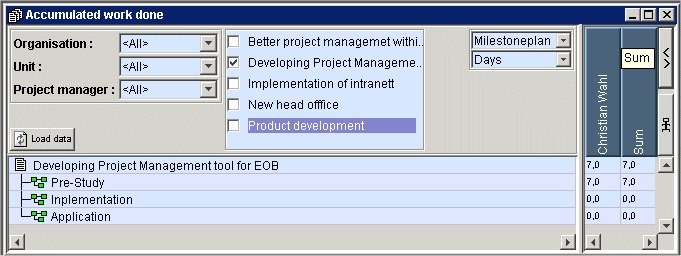
You may select other projects to as well by clicking on the
project name and the the button Load
data
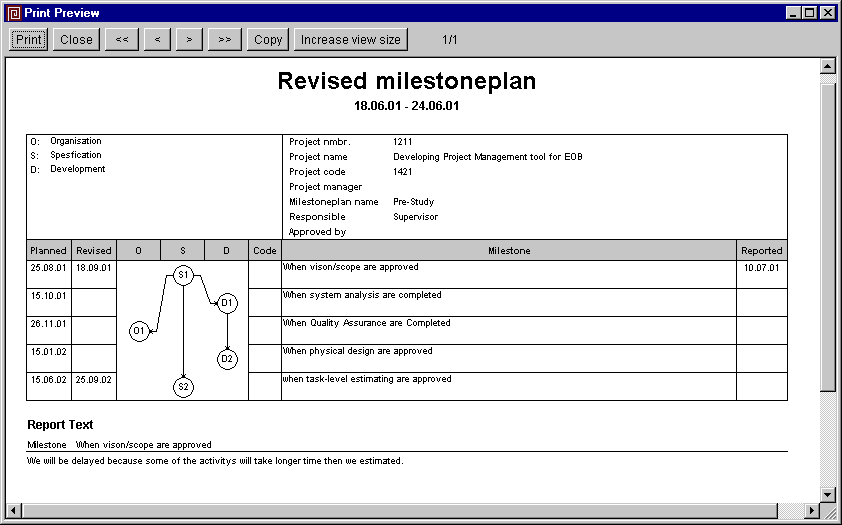
Revising Milestone Dates
Based on the information you have accumulated from your project team members, and aggregate reports, you may need to revise the Milestone Plan.
Click on Report>Revised Milestone plan.
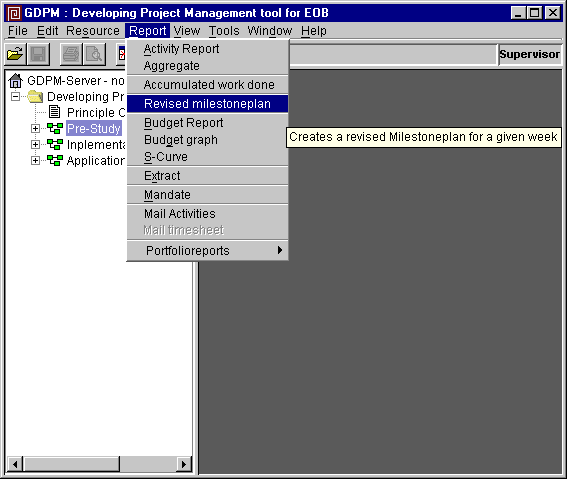
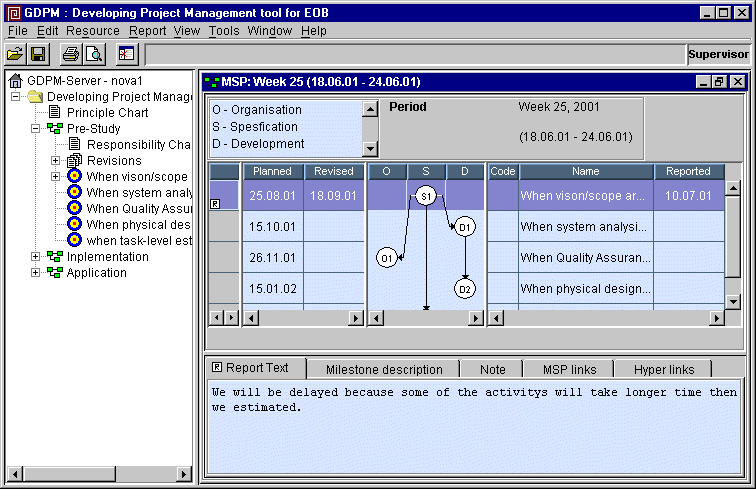
When you choose to revise milestone dates, a dialog box will open for you to enter the year and week that the revision is to be made.
You may enter a revised milestone date, report text, and the
date of the revision in the column entitled "Reported" for any
milestone.
Printing a report
Click on either the print or print preview icon and you may then select
several options regarding the format of the report (see below)
Click Ok to print.
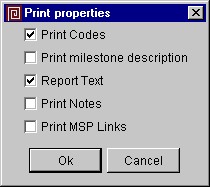
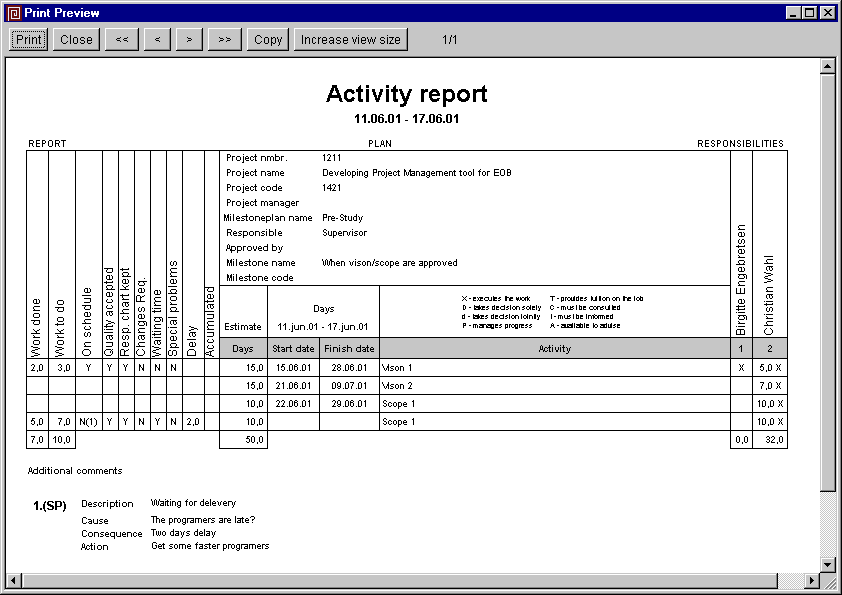
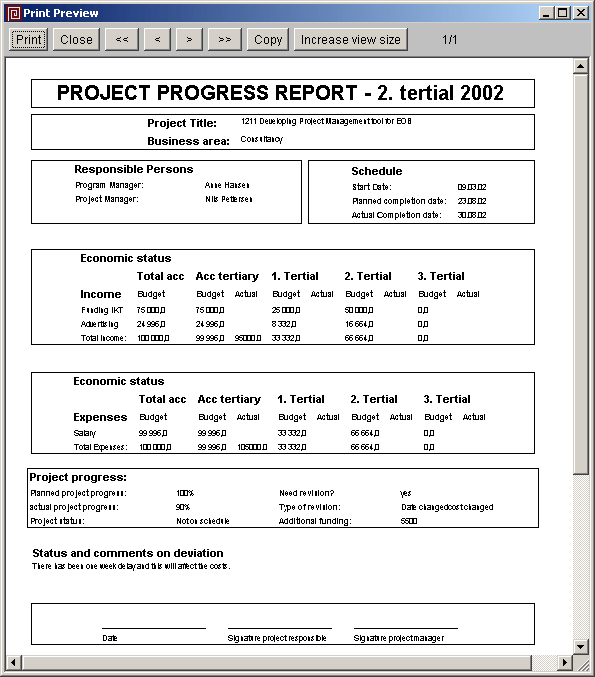
Here is an example of a print preview:
Extending finish dates for activities of milestone plans or milestones
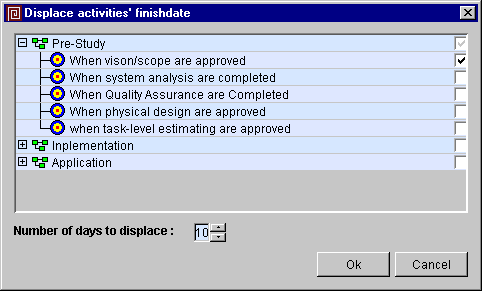
To report
on ongoing activities that are beyond the the planned finish date, you
must extend the finish dates.
To extend the finish dates for all activities belonging to a milestone or all activities belonging to a milestone plan, click Tools>Displace activity dates and select the Milestone plan, or specific Milestones and the number of days to displace.
Status report by Project Manager
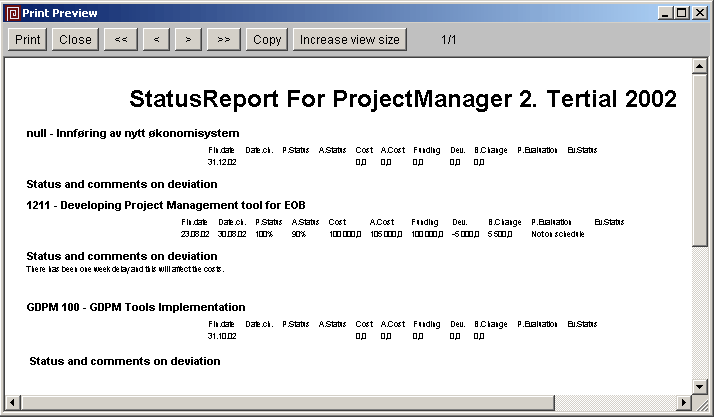
People who are the designated Project Manager in Project Properties have the option of reporting monthly progress and status on their projects. click Report>Status Report>Project leader and select the month and year you want to make the report for.
The report will include projects where the report month falls within
the project start and finish dates as defined in the project
properties.

The following fields are editable by the Project Manager:
Date changed: Proposed new finish date. Proposed change to the finish date will not be updated in the project properties, plans or budget. These changes must be updated manually in the Project properties.
Planned status: Narrative
Actual status: Narrative
Cost change: Proposed change to the cost will not be updated in the budget. This changes must be updated manually in the Project property>Budget dialogs.
Progress evaluation: select from pre-defined drop down list
box options
Status and comments on deviation
Revision: Date or number of this Status report
The report will initially show the last months revision number to help the project leader select a new revision number for the new report. (the revision field will be empty until the first report has been saved)
The data in this status report is included in the Progress
report (see below)
Status report by Program Managers
People who are the designated Program Manager in Project Properties have the option of reporting status on their projects. click Report>Status Report>Program manager and select the year and tertial period you want to make the report for.
This report displays only the projects where:
- the logged on person has status as Program Manager(defined in project
properties).
- the report period falls within the project's time frame as defined in
the project properties dialog (start and finish dates).

The program manager can approve/reject a Project Leader's
suggestion for cost change, by editing the field Funding change(+/-).
To view the report on screen, click the print preview icon in the tool
bar.
Progress report
Progress report is a printout containing:
- Project Properties
- Budget status
- Progress
This report
is generated using data from the Project Leader's Status Report
To generate
this printout you must have created a Project Leader Status report on
at least one project, and have one of your projects opened.
Click on Report> Progress report.
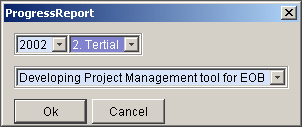
In the dialog choose the report period and the project you want the report for. Only projects of the logged on Project Leader are shown.
Budget Report
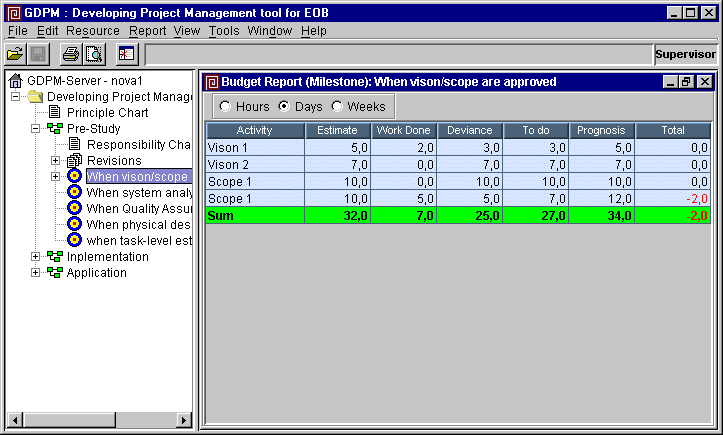
To print a Budget Report, highlight either a Project,
Milestone Plan or Activity Plan, the click on Report>Budget Report.
This report gives an overview of the following:
- Estimates (estimates from Activity Responsibility charts)
- Completed (the work hours that the project team members have reported as completed)
- Deviation (estimates vs. completed hours)
- Remaining (the work that hours the project team members have reported as remaining)
- Prognosis (the sum of hours completed and the reported remaining hours)
- Total (the original estimate minus the prognosis for completion)
The report below can be viewed on the screen by clicking Print preview icon or sent to the printer by clicking on the Print icon in the tool bar.
Budget Graph
To create a graphic presentation of the progress of the project, milestone plan or milestone, click Report>Budget Graph. The graph contains the following:
- Estimates (estimates from Activity Responsible charts)
- Completed (the work hours the project team members have reported as completed)
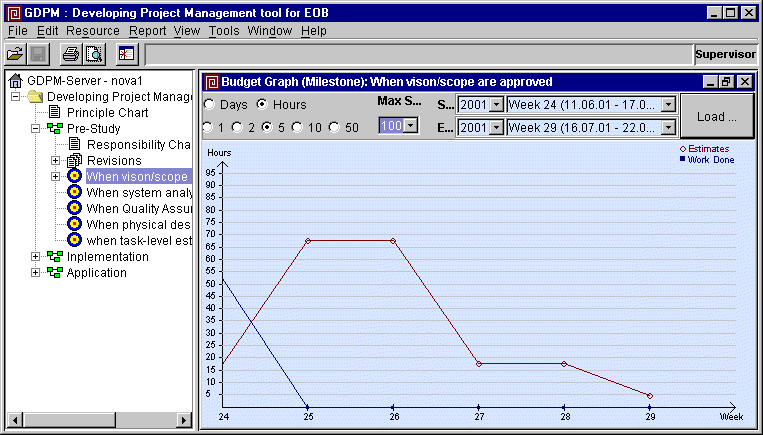
The report can be viewed on the screen or a sent to a printer by clicking on the appropriate icon in the tool bar.
S-Curve
To create a graphic presentation of the progress of the project, milestone plan or milestone including the prognosis, click Report>S-Curve. The graph contains the following:
- Estimates (estimates from Activity Responsible charts)
- Completed, in blue (the work hours that the project team members have reported as completed)
- Prognosis, in green (the sum of hours completed and the reported remaining hours)
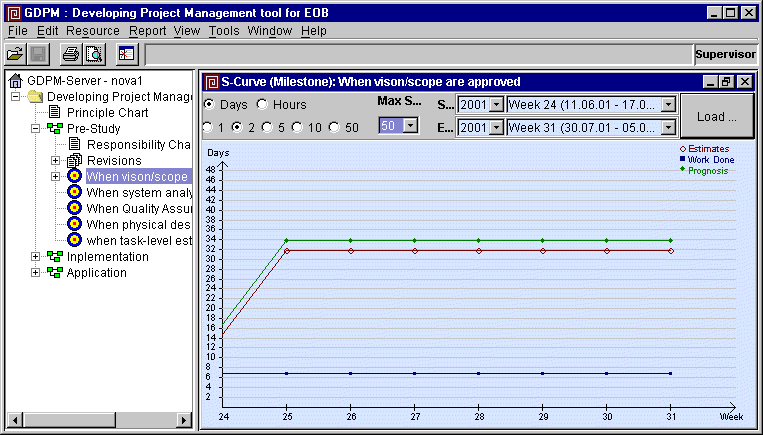
The report
above can be viewed on the screen or sent to the printer by
clicking on the appropriate icon in the tool bar.
Email Activities
If some team members do not have access to Goal Director, you can e-mail all of an open project's activities to them. This is accomplished by choosing Report>Mail Activities.
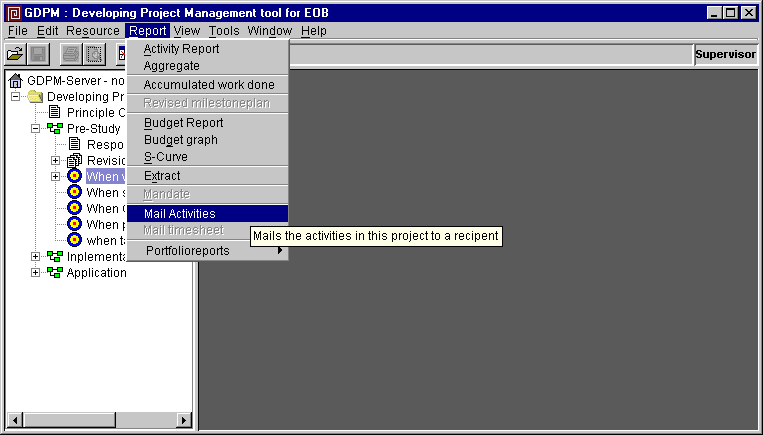
Goal Director sends all the activities listed under the open project to the specified participant.

Email Time
sheet
You can Email a time sheet to a person who is responsible for entering people's hours into the payroll system. To Email it, click Report>Mail time sheet.
Print Project description
This prints all the following information about the project, selected by year:
- Responsible persons
- Time frame
- Budget
- Mandate
- Milestone plans
To print
this report open the project, then highlight the project name and click
Report> Project description
No preview is available for this printout. It is sent directly to the
printer.
Administering Resources (Roles, Organizations and Persons)
Roles
The Principle chart and Milestone plan Responsibility charts use Roles (skills, groups) as defined for the organization. Click on Resource>Roles or Ctrl+Shift+R. A window will pop up with options to Add new roles, Delete or Modify existing roles. You can also add new Roles while you are working with the Principle chart or Milestone Responsibility charts.

Organizations and Units
You may
classify roles and persons by Organizations and Units. Click Resource>Organizations/Units
or Ctrl+Shift+O
In the
example below, you see that we have set up several organizations. New
organizations are set up by clicking on New and entering the name of the
organization you want to set up.
You may define Units within Organizations. Highlight the organization, click on New and enter the name of the new unit.
You may also include predefined role(s) in an organization and unit by doing the following:
- Highlight the organization and unit
- Highlight
role(s) and click on >>
to include those roles

Persons
Defining persons in the organization is done by clicking Resource>Persons or Ctrl+Shift+P.

Goal Director will generate a dialog box containing persons who have already been defined (eg. Supervisor). Those persons with full login privileges are shown in boldface type. To add a new employee, click on Add.
When adding a new employee, the following information should be filled in:
- Name :
First and last names
- Initials : Unique combination of letters, usually First letter of the first and last names
- E-mail : The person's e-mail address
- User name : If using Windows NT, the user name can be the same as the one for logging-on to the machine
- Password : The password that the person will need to supply during log-on.
- User group : User level access control as defined on the server
- Organization : The organizational entity the person belongs to (selected from drop-down list)
- Unit : The unit entity the person belongs to (selected from drop-down list)
- Roles : The role(s) the person has, or belongs to

All information entered for the person can be modified or deleted at any time by highlighting the person in the initial pop-up dialog and clicking Modify or Delete.
When you
are finished updating persons, click Close.

Project Classification Criteria
A project can be classified by using predefined criteria. Valid criteria are defined by clicking Tools>Criteria. The following classification criteria are available:- Business area
- Project Program
- Project Status
- Project Type
- Evaluation Status
- Progress Evaluation

Add
Click Add button, fill in criteria and click Ok to save.
Delete
Highlight the criteria you want to delete, and click Delete button.
Modify
Highlight the criteria you want to edit, and press Edit. Make changes,and press Ok to save.
Project portfolio
The project portfolio is an overview of the selected projects time frame(start- and finish date) in a Gantt format. The deviation between the finish date and revised date is printed in red. To open the project portfolio, click Report>Portfolio reports>Project portfolio

Resource utilization (extract planned and actual resources)
You can get a report of the estimated, completed, and future
resource utilization by clicking Report>Extract.
The resource extraction may be filtered per the drop-down list boxes
below.
You have the option of view
by activity or view by person
If you check Include Totals, you will be given sub-totals for the levels you have chosen for sorting.
To generate the report, click Load data

Below is an example of a Resource extract report.
In the example, we have created an overview of all activities
Christian Wahl is working on during Weeks 24 through 31 of 2001 in the
project entitled "Developing..." . In the gantt area there are 3
resource numbers shown for the activities: The top number shows the
reported Work done (actual completed), the middle shows how much Work
remains to be done, and the bottom number shows the original
estimate
Sub-totals are given for every milestone plan:
The bottom of the report shows the Totals for the person and the selected project(s).

Selecting Language
From the Tools menu you can choose the language you want to use for the task codes and printouts presented on your machine or the language for the entire application. The language you select will be utilized in all projects.
You switch languages by clicking Tools>Language and select the language you want. To change the application language, you must restart Goal Director to activate the changes.
Click Ok and you have changed the language according to your choice.

Program Preferences
Click Tools>Preferences
Under the General tab, you have the following choices:
- 4 chars in year = all date formats in the application will display the year as 4 numbers (YYYY).
- Small font in printout = all printouts will have an 8 pt. font.
- Preview in Landscape = all previews will show up in the Landscape format.
- Preview in A3 = all previews will be shown in A3 format.
- Show the organization-abbreviation as a person-prefix = you will be able to search for persons within organizations
- Auto resize the width of the task codes table = all responsibility charts will automatically adjust the size of the frame for roles/persons.
- Default timescale = Set the estimating unit as the default throughout Goal Director.
- Default gantt scale = Set the gantt scale as the default throughout Goal Director.

Under the E-mail tab, you have the following choices:
- E-mail Address = your own standard e-mail address. Must be added under resource menu.
- SMTP Server Host = the name of your email server
- Port = the port you use for mail
- Time sheets = the initial e-mail address you want Goal Director to display when you want to email your time sheets.
- Activities = the initial e-mail address you want Goal Director to display when you want to email all project activities.

Under the Server tab, you have the following choices:
- Server Host name = Enter the Goal Director server's computer name (as recognized by the network) or its IP address.
- Server Port Number = You can specify
which port Goal Director will use when being run as an application
applet. The default is 1099.

Checking-out a project from the server
You have the option to work on your project off-line in a local database on your workstation or laptop computer. This function allows you to check-out one project from the project database ("library"). When you check-out a project, the server locks the project, such that no one else can make changes to the same project before you have checked it in again. Note: When you check-out a project, previously checked-out projects on your local machine will be deleted..
Check-out project
To check-out a project from the server, click Tools>Check-out project. Goal
Director will download the project to your local workstation off-line
database.
Check-in project
To upload the project back to the server click Tools>Check-in project.
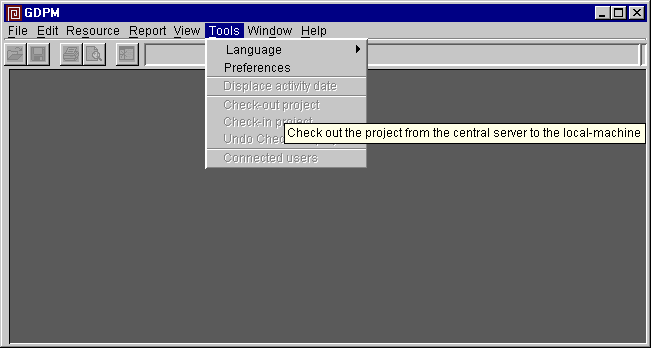
Undo Check-out project
Click Tools>Undo Check-out project.
If you made changes to the project on your local computer you will lose
any of those changes.
Connected users
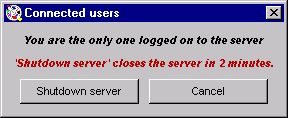
You can find out which other users are connected to the Goal Director server by clicking Tools>Connected Users. Goal Director displays the users who are connected so you can send them a message to quit Goal Director.
Copying the Database
CAUTION:
The following functions should only be used by experienced users.
They can cause your existing database to be overwritten.
Alternatively,
you may use your operating system's file copying functions to achieve
similar results.
In any case,
you should back up your database on a regular basis.
This function gives you the ability to copy the database you are working with, or select another database to work with. Before you log on to Goal Director, you will see the function File>Copy Database under the File menu. If you are already working with Goal Director, choose Log Out under the File menu and Copy Database will be archived.
When you have chosen Copy Database, the following dialog box will pop up.
If you choose to save the database to a file, your current database will be saved to the named file. From that location, it can be used as an alternate database, either by you or other Goal Director users.
The following specific function must
be used with caution.
If you wish to save a database other than your existing database to an
alternate location, highlight Choose File, which will become the
database. Before you execute this function, it is highly recommended
that you make a copy of your existing database, so as to prevent any
loss of information. It can cause your existing database to be
overwritten.